BlockVizBlockViz
Price
Market Cap
Portfolio
Simulators
Resources
Pricing

Price

  • KPI Tracker
  • Techn. Analysis Chart
  • Indexed Comparison
  • Asset Risk Analyzer
  • Best & Worst Days
  • Seasonality Heatmap

Market Cap

  • Dominance
  • Development
  • Treemap

Portfolio

  • Tracker
  • Development
  • Comparison
  • Risk Analyzer

Simulators

  • Market Cap Parity
  • HODL vs. DCA
  • Coin Flip
  • Sell and Buy Back
  • Stop Loss
  • Portfolio Rebalance

Resources

  • Coins
  • Guides
  • Wiki
  • Blog
  • News

Community

X.comCMCBinanceYouTubeLinkedInDiscord

Product

PricingRewardsPartnersAll Tools

Resources

CoinsGuidesWikiNews

Company

AboutContactSupportLegal

Data provided by

CoinGecko

© 2026 BlockViz.xyz
All rights reserved.

Market structure workspace

Compare. Contextualize. Stress-test.

BlockViz – Compare relative performance, map market structure, and stress-test crypto decisions.

BlockViz unifies indexed comparisons, dominance and treemap views, portfolio intelligence, and scenario simulators into one focused workspace.

Explore tools Get free access
Traders
Spot rotation, levels, momentum.
Analysts
Repeatable analytics, clean visuals.
Funds & Research
Portfolio benchmarking & risk context.

No credit card required.

Price

Indexed Comparison

Normalize assets to 100 to see leadership shifts.

Indexed Comparison screenshot
Portfolio

Portfolio Comparison

Compare portfolios on an indexed basis.

Portfolio Comparison screenshot
Structure

Market Cap Treemap

Track composition and movers with a single view.

Market Cap Treemap screenshot
What if

Scenario Simulator

Model parity paths and stress-test decisions.

Scenario Simulator screenshot

Problem

Crypto data is loud, fragmented, and hard to compare.

Traders and research teams need clean relative context, not endless dashboards. Without structured comparisons and scenario tools, it is easy to miss leadership shifts, concentration risk, and decision impact.

Common symptoms

Leadership looks random.
Breadth is unclear.
Allocation decisions lack context.
1

Price hides relative strength.

Single charts don’t reveal leadership, rotation, or breadth.

2

Structure is hard to read.

Dominance, composition, and concentration live in separate views.

3

What-if testing stays manual.

Spreadsheet workflows slow iteration and reduce decision quality.

Impact
Missed rotations, hidden concentration risk, and untested sizing decisions.

Solution

A single workspace for market context and portfolio decisions.

Compare relative performance, map structure and concentration, then stress-test changes before sizing decisions.

What you get

Relative strength & rotation
Structure & concentration risk
Drawdowns & regime context
Scenario outcomes for decisions
Explore workspace Benchmark a portfolio

Step 1 - Compare

Normalize performance and spot leadership.

Indexed comparison, best and worst days, and seasonality expose relative strength.

Indexed ComparisonSeasonalityBest/Worst Days

Step 2 - Map Structure

Understand market structure at a glance.

Dominance, treemap, and market cap development show composition and share drift.

TreemapDominanceMarket Cap Development

Step 3 - Stress-test

Quantify the decision before capital moves.

Parity, DCA, flip, stop loss, and buyback simulations compare outcomes fast.

ParityDCACoin FlipBuy BackStop LossRebalance

Step 4 - Allocate

Tie insights back to real positions.

Portfolio tracking and comparison reveal what drives risk and return.

Portfolio ComparisonPortfolio DevelopmentPortfolio TrackerPortfolio Risk

Tool suite

Every tool you need to read the market fast.

Use the full set of 19 tools or pick a single workflow. Each tool is designed to answer a specific decision quickly.

Price6 tools

Relative performance, momentum, and return structure.

KPI Tracker screenshot
KPI Tracker

Real-time prices, sparklines, and market-cap-ranked market overview.

Technical Analysis Chart screenshot
Technical Analysis Chart

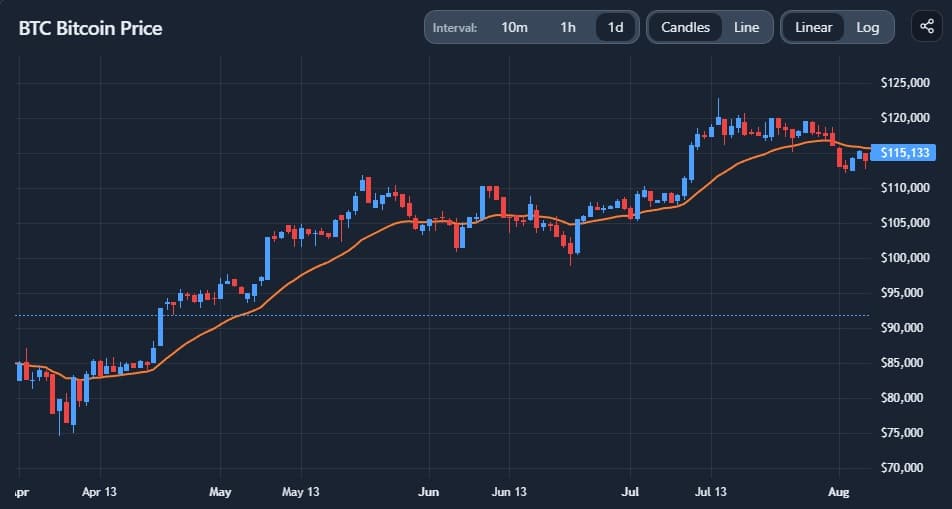
Candles, indicators, log or linear, multi-interval views.

Indexed Comparison screenshot
Indexed Comparison

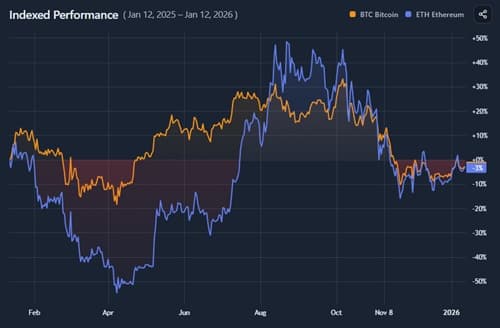
Normalize two assets to 100 and compare leaders.

Asset Risk Analyzer screenshot
Asset Risk Analyzer

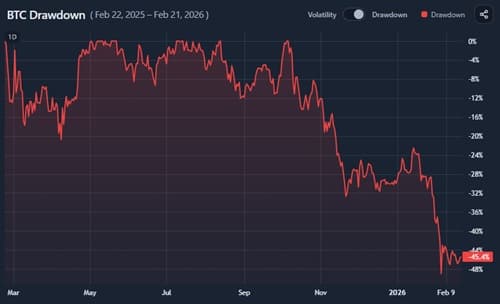
Rolling volatility, drawdown, and downside-risk profile for one asset.

Best and Worst Days screenshot
Best and Worst Days

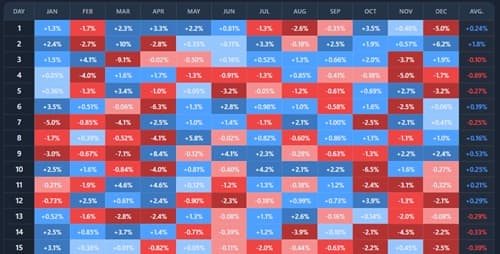
Daily return heatmap with top and bottom day impact.

Seasonality Heatmap screenshot
Seasonality Heatmap

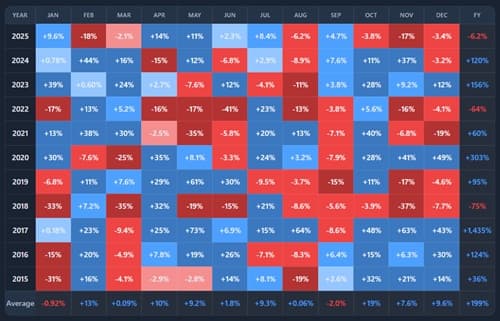
Monthly or quarterly returns across years and averages.

Market Cap3 tools

Share, structure, and composition shifts.

Dominance screenshot
Dominance

Track market share vs total or custom baskets.

Market Cap Development screenshot
Market Cap Development

Absolute caps and share percent in one view.

Treemap screenshot
Treemap

See structure by coin or category with delta mode.

Portfolio4 tools

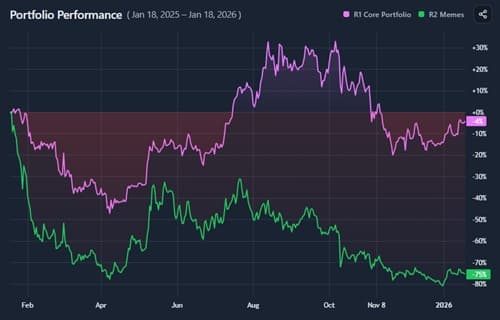
Value, allocation, and performance diagnostics.

Portfolio Tracker screenshot
Portfolio Tracker

Holdings, PnL, allocation, and value over time.

Portfolio Development screenshot
Portfolio Development

Value and share drift across positions.

Portfolio Comparison screenshot
Portfolio Comparison

Indexed comparison of real or model portfolios.

Portfolio Risk screenshot
Portfolio Risk

Volatility, drawdowns, tail risk, and concentration diagnostics.

Simulators6 tools

Stress-test decisions before you place the trade.

Market Cap Parity screenshot
Market Cap Parity

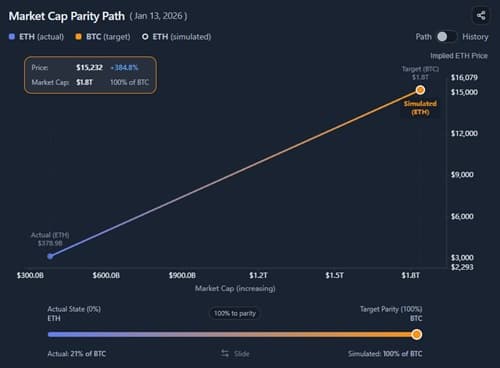
Implied price if an asset matched another market cap.

HODL vs DCA screenshot
HODL vs DCA

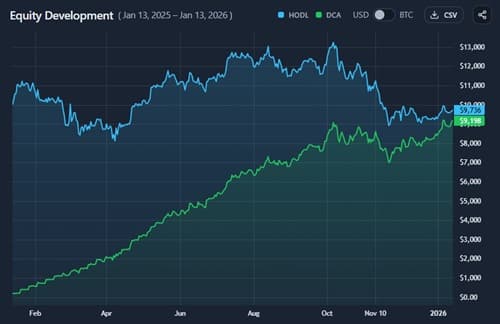
Lump sum vs DCA results over a chosen timeframe.

Coin Flip screenshot
Coin Flip

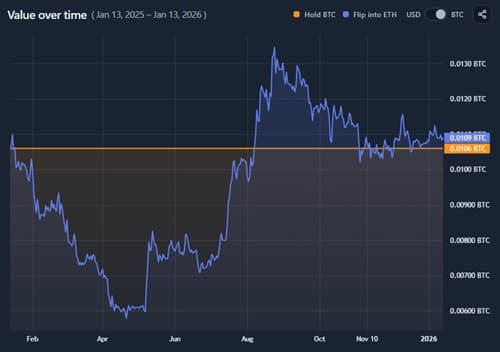
Switch base asset into a target and compare outcomes.

Sell and Buy Back screenshot
Sell and Buy Back

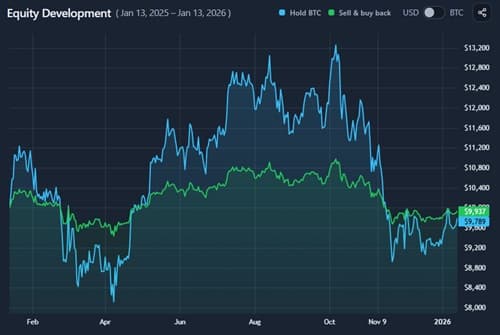
Trim, hold cash, and re-enter vs holding.

Stop Loss screenshot
Stop Loss

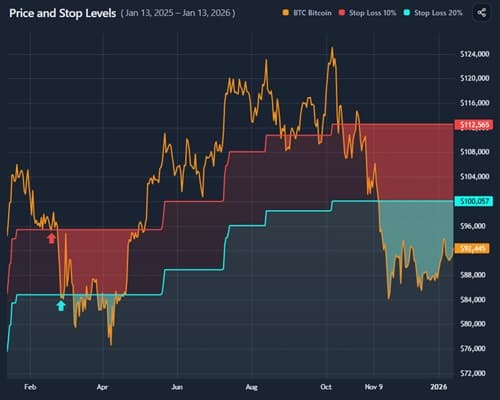
Fixed and trailing stop outcomes on history.

Portfolio Rebalance screenshot
Portfolio Rebalance

Buy-and-hold versus scheduled rebalancing to target weights.

Built for

Built for traders, funds, and analysts who need clarity on relative performance and market structure.

Compare assets and portfolios, track dominance and composition, and stress-test decisions in one workspace.

TRADERS

Move fast with decision-ready context.

  • Switch timeframes, log/linear, and indicators without losing structure.
  • Spot leadership shifts, drawdowns, and momentum at a glance (indexed, best/worst days).
  • Stress-test entries, trims, DCA, and stops before committing capital.

ANALYSTS

Clean visuals and repeatable context for writeups.

  • Validate narratives with normalized comparisons and seasonality views.
  • Map “what moved” with treemaps and dominance, not just price lines.
  • Pull key context fast: min/max, drawdowns, and relative outperformance.

FUNDS & RESEARCH

Benchmark baskets and allocations without tool sprawl.

  • Run basket-level dominance and composition analysis to monitor rotation.
  • Compare real portfolios vs model allocations on indexed performance.
  • Keep a repeatable workflow for notes, updates, and allocation decisions.

Get started

Launch the workspace and start with a tool.

Explore the tool suite now, then create a free account to save watchlists, portfolios, and simulator setups.

Explore tools Get free access
Free access includes
Full tool suite with live and historical views.
Watchlists, categories, and portfolio tracking.
Scenario simulators and share-based analytics.

Lock in your workflow now. Simply sign in and go.